 |
The |
Executive Summary: The Current Structure of State Government in Arkansas
1. During the 1960s, Arkansas' state government expanded to comprise "170 state agencies possessing varying degrees of independence and run by persons appointed in a variety of ways." (quote from a 1978 report by Winston Bryant). By the end of the 60s, Republican Governor Winthrop Rockefeller wanted to scale state government back to a more manageable size.
2. It wasn't until a Democrat, Dale Bumpers, followed Rockefeller as the state's chief executive in 1971 that a state government reform plan was adopted by the state legislature. Under the plan, Bumpers consolidated more than 60 agencies into 13 major state agencies. He also shifted state government's day-to-day functions to a "corporate" model of management in which each agency head answered directly to the Governor as the state's Chief Executive Officer (CEO). Moreover, Bumpers designated the agency heads as his "cabinet".
3. State reorganization efforts during the 60s and 70s typically involved six steps to which Bumpers apparently subscribed: a) grouping agencies into broad functional areas aligned with more traditional functions of government, b) establishing relatively few departments to enhance the span of control and pinpoint accountability to the chief executive c) delineating single lines of authority to the CEO d) administering departments by single heads e) reducing confusion in service delivery for the public 0 cost savings and efficiency.
4. UCLA political scientist James Q. Wilson says, "Government always gets bigger." It appears he is right. In the period between 1971 (Bumper's reform) and 1978, the number of agencies slowly crept back up from 13 to 20, followed by a dramatic surge in bureaucratic growth in the years that followed. By the early 1990s the number of boards and commissions more than doubled and the number of state agencies quadrupled. The number of state employees more than tripled from 20,000 in 1978 to a current figure in excess of 60,000. During this same period (1971 to 1996) the population of Arkansas modestly increased by 25% and student enrollment in the public K-12 system remained essentially static at around 450,000.
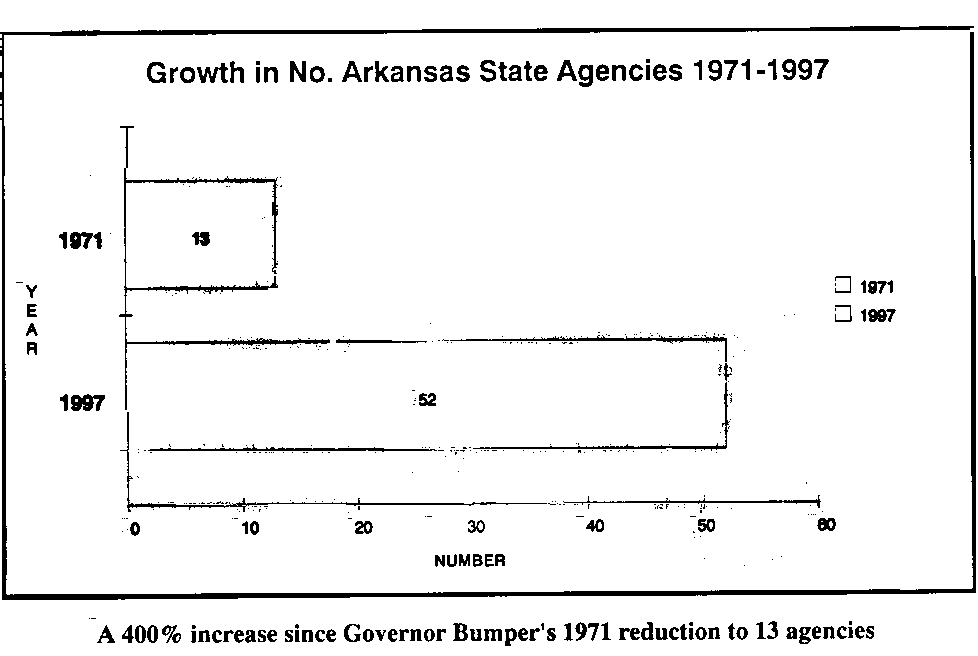
5. Today, Arkansas' state government comprises 52 executive branch agencies--a 400% increase since Governor Bumpers' 1971 restructuring that reduced the number of agencies from 171 to 13. It also comprises 388 boards and commissions--more than double the 175 that existed in the early 70s. More than 4000 operational units are structured into state govermnent's various divisions and agencies according to state government organizational charts. The actual number is estimated to be more in the range of 7000-8000 distinct operational units.
6. Total state payroll for all state employees is $1.4 billion (1997) and the amount of travel expenses paid state employees in 1997 was $34.5 million. The State of Arkansas owns 1,073,522 acres of land making it the third largest land owner in the state (the Federal government is the largest). Of the state's property, 38,170 acres are in 48 state parks. Museums occupy 58 acres. The state owns 5,302 buildings. The total number of vehicles owned by the State of Arkansas is 7,281 and the number of airplanes is 30. Arkansas' highway miles total 16,254. The Federal Interstate System in Arkansas comprises 542 miles.
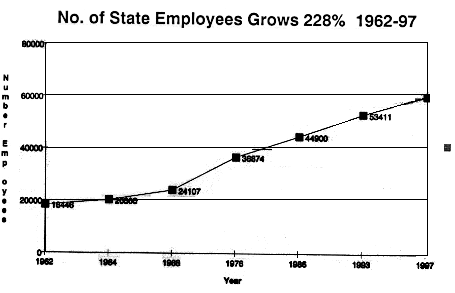
7. Arkansas' state government is the largest single employer in the state. Figures from the state's Employment Security Division (ESD) put the current number--including higher education employees--at 60,500, more than Wal-Mart, 32,412, Tyson's Foods, 21,500, and the Baptist Hospital System, 6,200. Factor in some 101,5001ocal government employees and the combined state/local government employee figure hits 162,000. Add in the 21,400 federal employees working in Arkansas and the total government employment figure (for all governmental levels) tops out at 183,400. The number of state employees, excluding the state's 57,257 public school employees, has risen 228% since 1965.
8. Among the fifty states, Arkansas ranks 33rd in population but 12th in numbers of state employees as a percentage of total state employment--4.29% (the national average is 3.2%). Expressed as numbers of state employees per 10,000 citizens, Arkansas ranks 23rd among the states at 220. The national average of state workers per 10,000 citizens is 182.
9. In 1981 Governor Frank White imposed a hiring freeze in Arkansas' state government and every governor since then, including Governor Mike Huckabee, has renewed the freeze with their own executive order. In spite of these restraint measures, the number of state employees has continued to grow, rising some 30% during a 16 year "freeze." Federal programs account for some, but not all, of this growth.
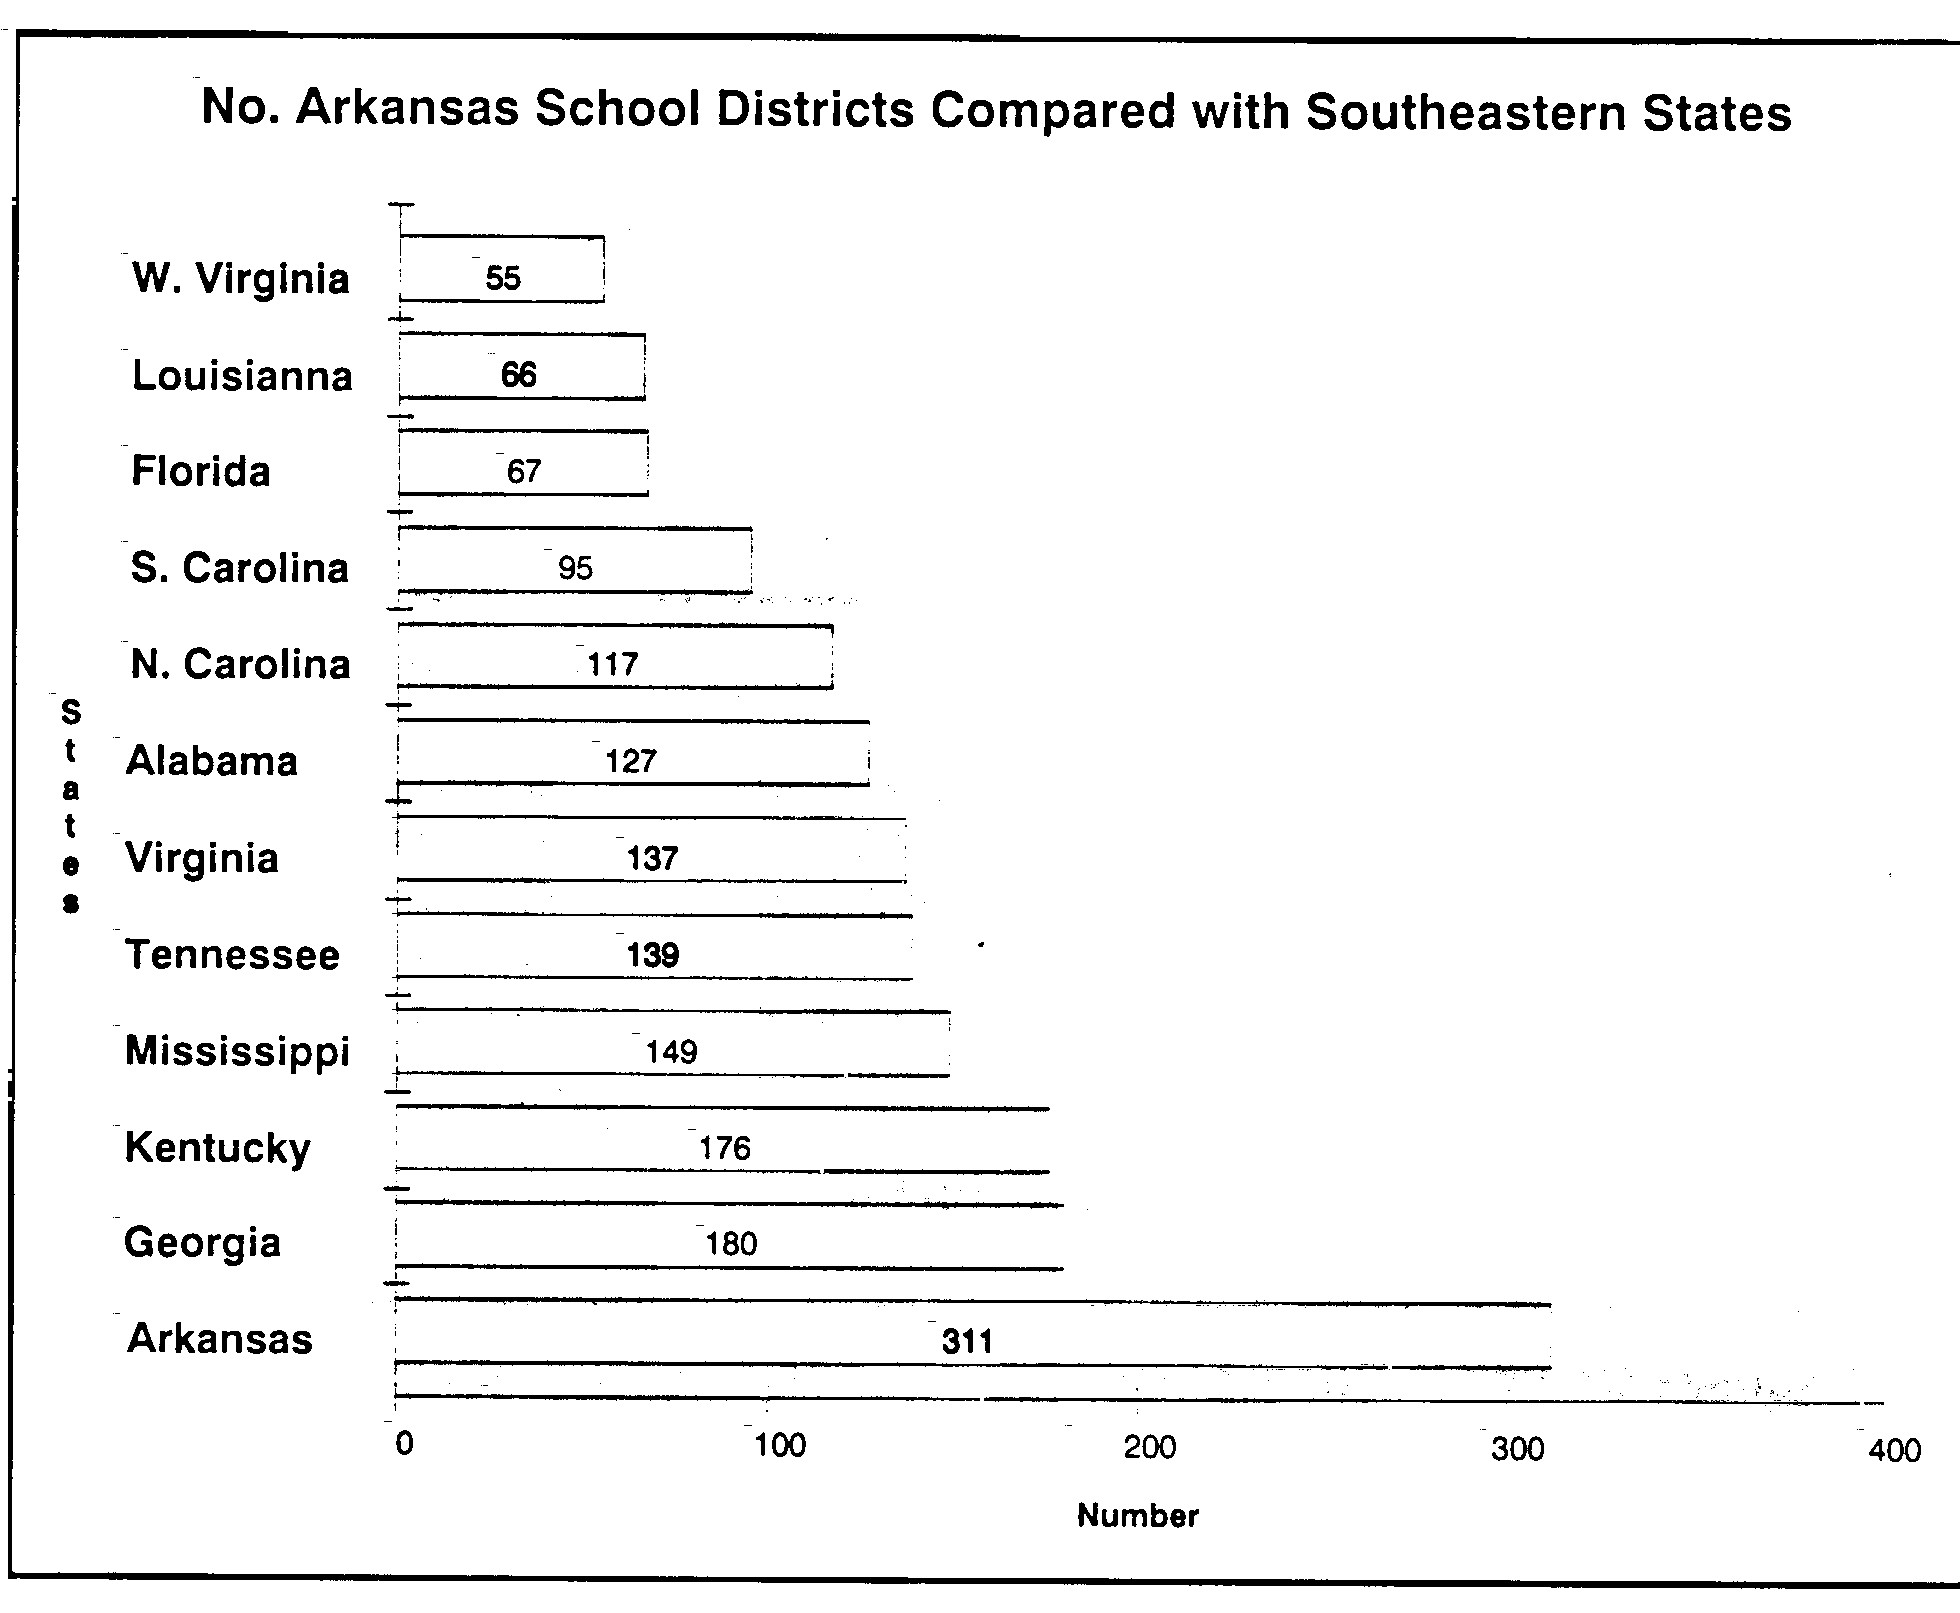
10. Arkansas school districts number 311. Arkansas ranks 17th among the 50 states in the highest number of school districts. Among its nine Southeastern state neighbors, Arkansas ranks first in the highest number of school districts, with 135 more than Kentucky, the next highest with 176 districts. Arkansas ranks 34th in school enrollment.
11. Eighty-six percent (86%) of Arkansas' Department of Education's operations are federally funded.
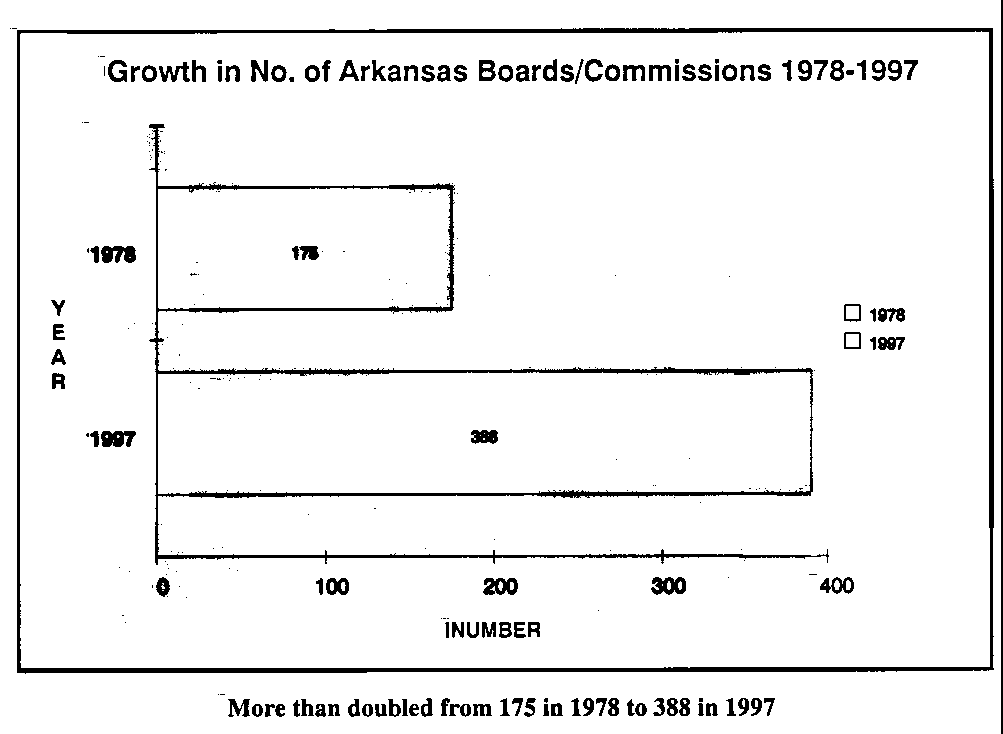
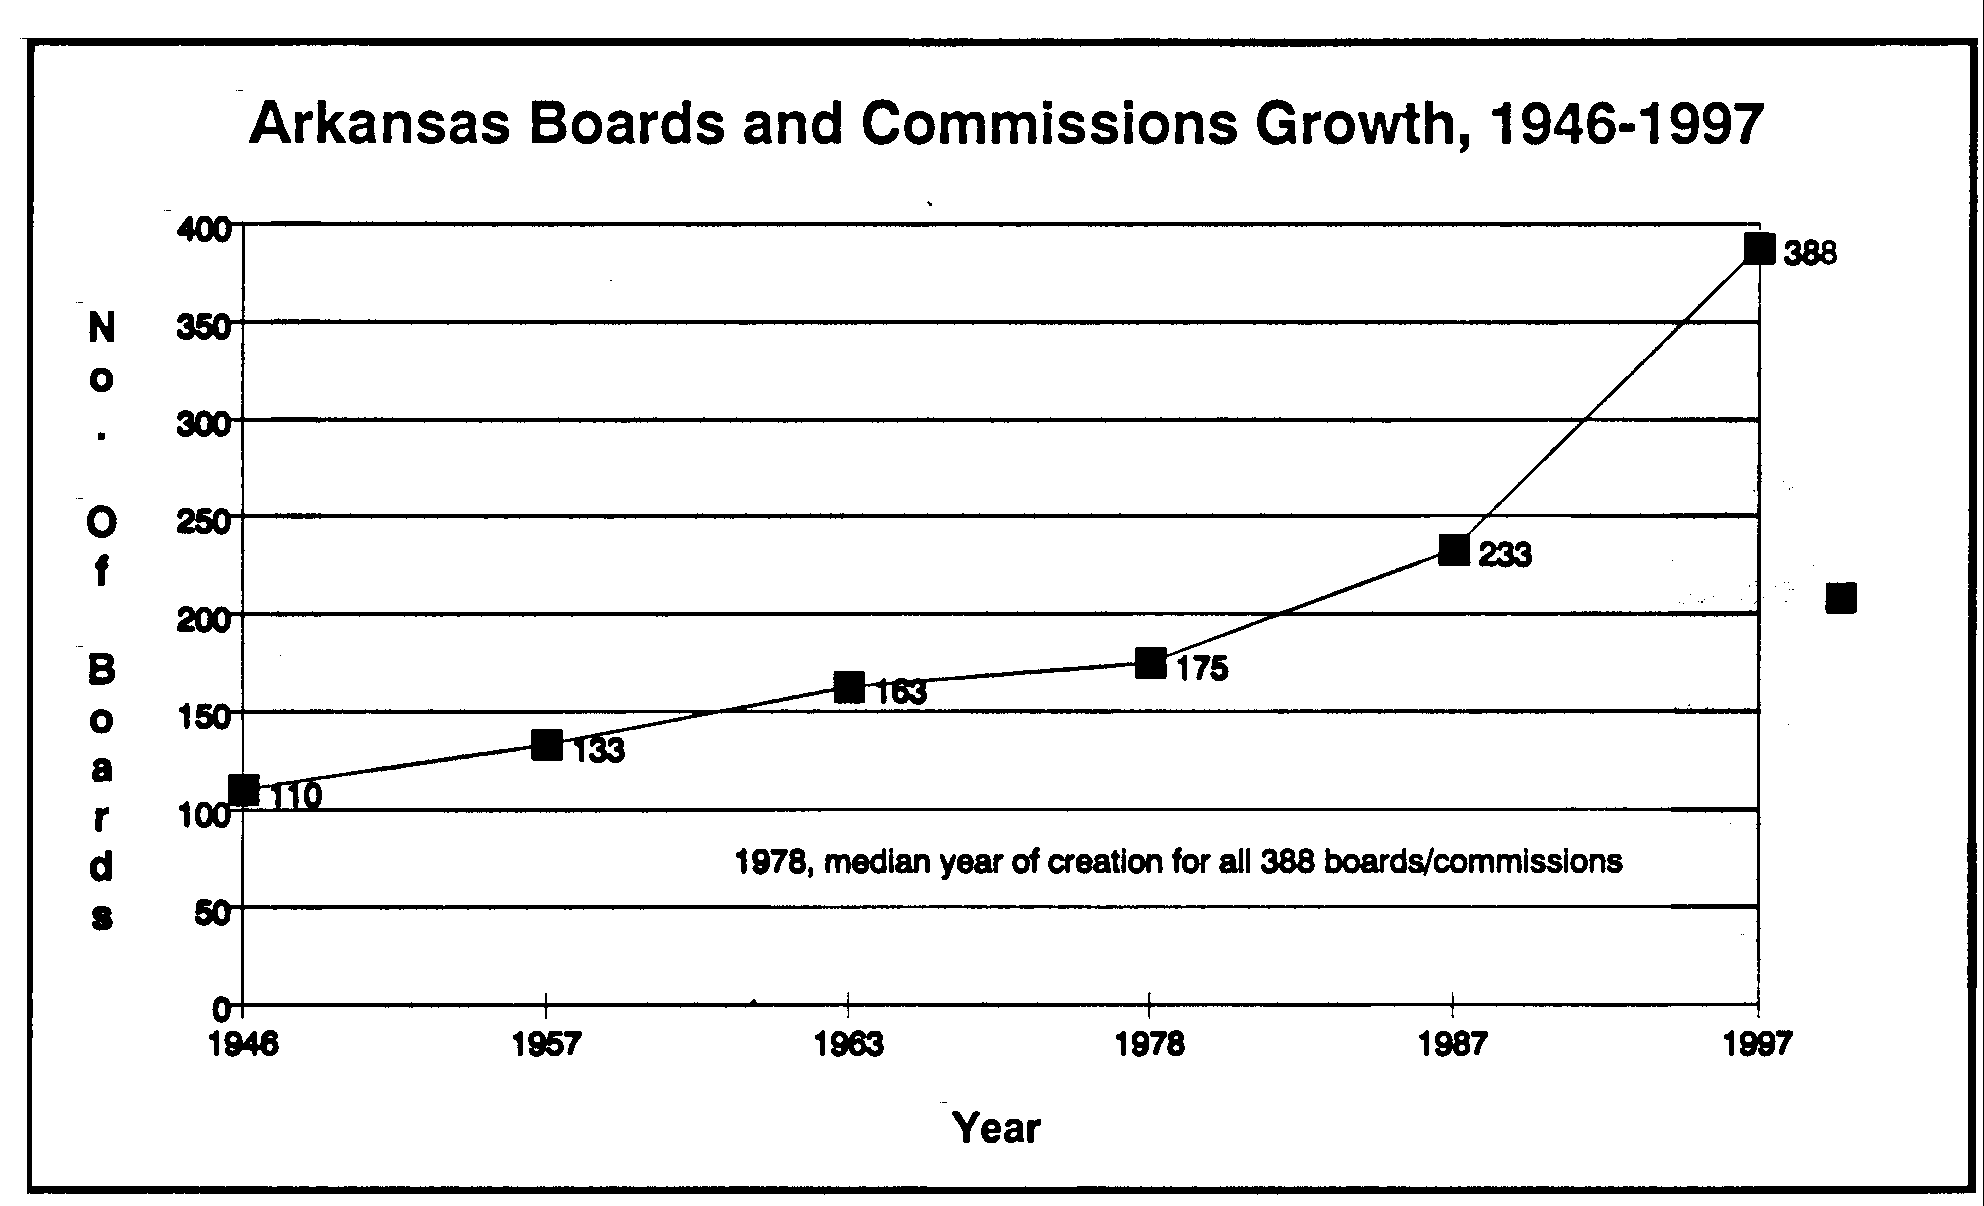
12. Boards and commissions have also undergone extraordinary growth since the early seventies when the number hovered around 175. Today the number of Arkansas boards and commissions is 388...and growing. A closer look at the trend shows that the median year of creation for all Arkansas boards and commissions is 1978, meaning half of them (in the 123 years since Arkansas adopted its current constitution) were formed in just the last 19 years. In 1983, Arkansas, led by then Governor Clinton and backed by both houses of the legislature, allowed its sunset law on boards and commissions to elapse. Some 37 states have sunset laws to govern growth of boards and commissions.
13. Total state spending (inclusive of federal funds) has risen sharply over the last three decades. Analysis shows that in 1962 Arkansas spent $294 million. Today the figure is just under $8 billion. Adjusted for inflation, growth in state spending, from the mid 60s until now, represents a 452% increase. The sharp upward trend shows that since the mid 1970s spending has doubled every ten years. This raises an important tax policy question. How much longer can Arkansas' taxpayers sustain the continued expansion of their government at this rate?
14. Arkansas' budget, in recent years, has grown at an annual rate of 6.5%, more than twice the rate of inflation. Arkansas' spending today is twice what it was in 1980 and during the last decade and a half the state's spending growth rate per capita has become the nation's 16th fastest.
15. Since 1980, state spending has consistently outpaced the rate at which Arkansans generate income. Arkansas' spending during that time grew by 57% and Arkansans' personal income grew by 40%. The state spends money faster than Arkansas families can make it.
16. From 1980-1993, state revenue per $1000 of personal income in Arkansas increased by 19%, more than double the national average. This means the share of Arkansans' income taken by state government has changed from 6.3% below the national average (1980) to more than 3.3% above the national average (1993). Compared to neighboring states in the Southeast, it is 7.7% higher.
17. Between 1992 and 1995 real growth in the state's general revenue was 19.5% and the rate of growth in personal income over the same period was 10%, showing that in recent years the state generates its income at twice the rate as that of its citizens.
18. According to State Policy Reports (SPR) Arkansas ranks first in the nation in per capita rate of increase in combined local and state tax burden --40.9%--and well above the national average of 27.3%.
19. The Arkansas Tax Data Book, prepared by the Bureau of Legislative Research, documents 189 different tax and fee sources of Arkansas revenue.
20. Federal programs have a profound impact on the structure, function, and cost of state government. Many states see their administrative and grants management costs escalating as the federal presence increases With 26% of the state's
total revenue currently provided by the federal government, what seems to be developing in Arkansas, and in other states, is a form of quasi state/federal government in which funds from Washington can also mean a measure of control by Washington. More block granting, waivers, and outright rejection of some federal funds are being pursued in all states to lessen the impact of the federal programs at the state level.
21. State government is massive with as many as 7000 separate operating units. Its size has been created by an extraordinary rate of expansion. And finally, state government is complex, so much so that ordinary citizens are confused and intimidated by it. It is these three conditions, along with government's own apparent inability to reverse them, that lend credence to the idea of a citizen-driven review such as the Murphy Commission. As one Commission member succinctly put it, "These trends raise flags to be sure, and maybe we--as citizens--ought to take a closer look at what's going on before allowing them to continue too many more years."
22. The Commission's discovery that no comprehensive visual overview of state government existed defined one of its major tasks. It would create what did not exist for Arkansas nor in any other state; a comprehensive, detailed organizational chart for state government. Moreover, it would backup this visual portrayal of government with a written report on some of the key trends that drove the creation of government's current organization. This in turn would form the second major report of the Commission. The organizational chart, having been produced for display, is 81/2 feet deep by 25 feet long.
23. In reviewing the state's structure, it is apparent that some state agencies have undergone a varying degree of re-fragmentation since they were integrated under Governor Bumpers. In the process, various components of their missions have been organizationally allocated across a broad spectrum of government agencies, programs, arid departments. It is also apparent that a number of administrative functions, as a result of this fragmentation, have also been duplicated throughout government's structure resulting in redundancy and loss of efficiency. Review of the organizational chart also shows some layers of middle management that may be unnecessary in a number of agencies. These are among the initial observations that Commission teams reviewing some 15 state agencies will follow-up on in more detail as their work continues in the months ahead.
24. This Murphy Commission report on the current structure of Arkansas' state government reveals our state, like many other states, is well into the trend of more, bigger, and costlier government. Its findings show that a phenomenal rate of growth, spending, and expansion over several decades have combined to drive the cost of government steadily up while spawning a burgeoning bureaucracy of enormous magnitude and complexity. What does all of this tell us? It confirms that we pay for a huge amount of government. The question to be answered now is this: Are we Arkansans being taxed for more government than we need? The Murphy Commission will have the answer when its work is finished. It will be shared with all Arkansans.
EXHIBIT 1
Sources: Historical Report of the Secretary of State. Arkansas. Vol.I, and the Arkansas Department of Finance and Administration.
Following Governor Dale Bumper's 1971 reduction of Arkansas state agencies from 170 to 13, the number has climbed back to 52, a 400% increase in slightly more than 25 years.
EXHIBIT 2
Sources: Historical Report of the Secretary of State. Arkansas. 1978, Vol. 1, and independent research by the Murphy Commission in concert with the Governor's Office on Boards and Commissions as well as the Department of Finance and Administration.
Winston Bryant, serving as Arkansas' Secretary of State in 1978, noted in the study cited that Arkansas had 175 Boards and Commissions in 1978. The number has more than doubled and now stands at 388 and growing. Some 37 states have sunset laws to govern growth and longevity of boards and commissions. Arkansas passed such a law in 1977. Governor Clinton and both houses of the state legislature let it lapse in 1983.
EXHIBIT 3
Sources: Council of State Governments, Book of the States (for all years except 1997). Employment Security for 1997 figure.
The number of state government employees increased from 18,446 in 1962 to 60,500 in 1997, an increase of 228%. The population of Arkansas increased during this same period about 30%. The chart graphically illustrates dramatic upward growth in state employees beginning in the early 1970's, much of it driven by the increasing impact of federal programming implemented at the state level. Many new employee positions, both state and federally funded, were created in response to federally funded programs, grants and contracts. Among the fifty stares, Arkansas ranks 33rd in population but 12th in numbers of state employees as a percentage of total state employment--0.29% (the national average is 3.2%). Expressed as numbers of state employees per 10,000 citizens, Arkansas ranks 23rd among the states at 220. The national average of stare workers per 10,000 citizens is 182.
EXHIBIT 4
Source: The number of Arkansas schools districts was provided by the Arkansas Education Association. Figures for other states supplied by each state's Department of Education.
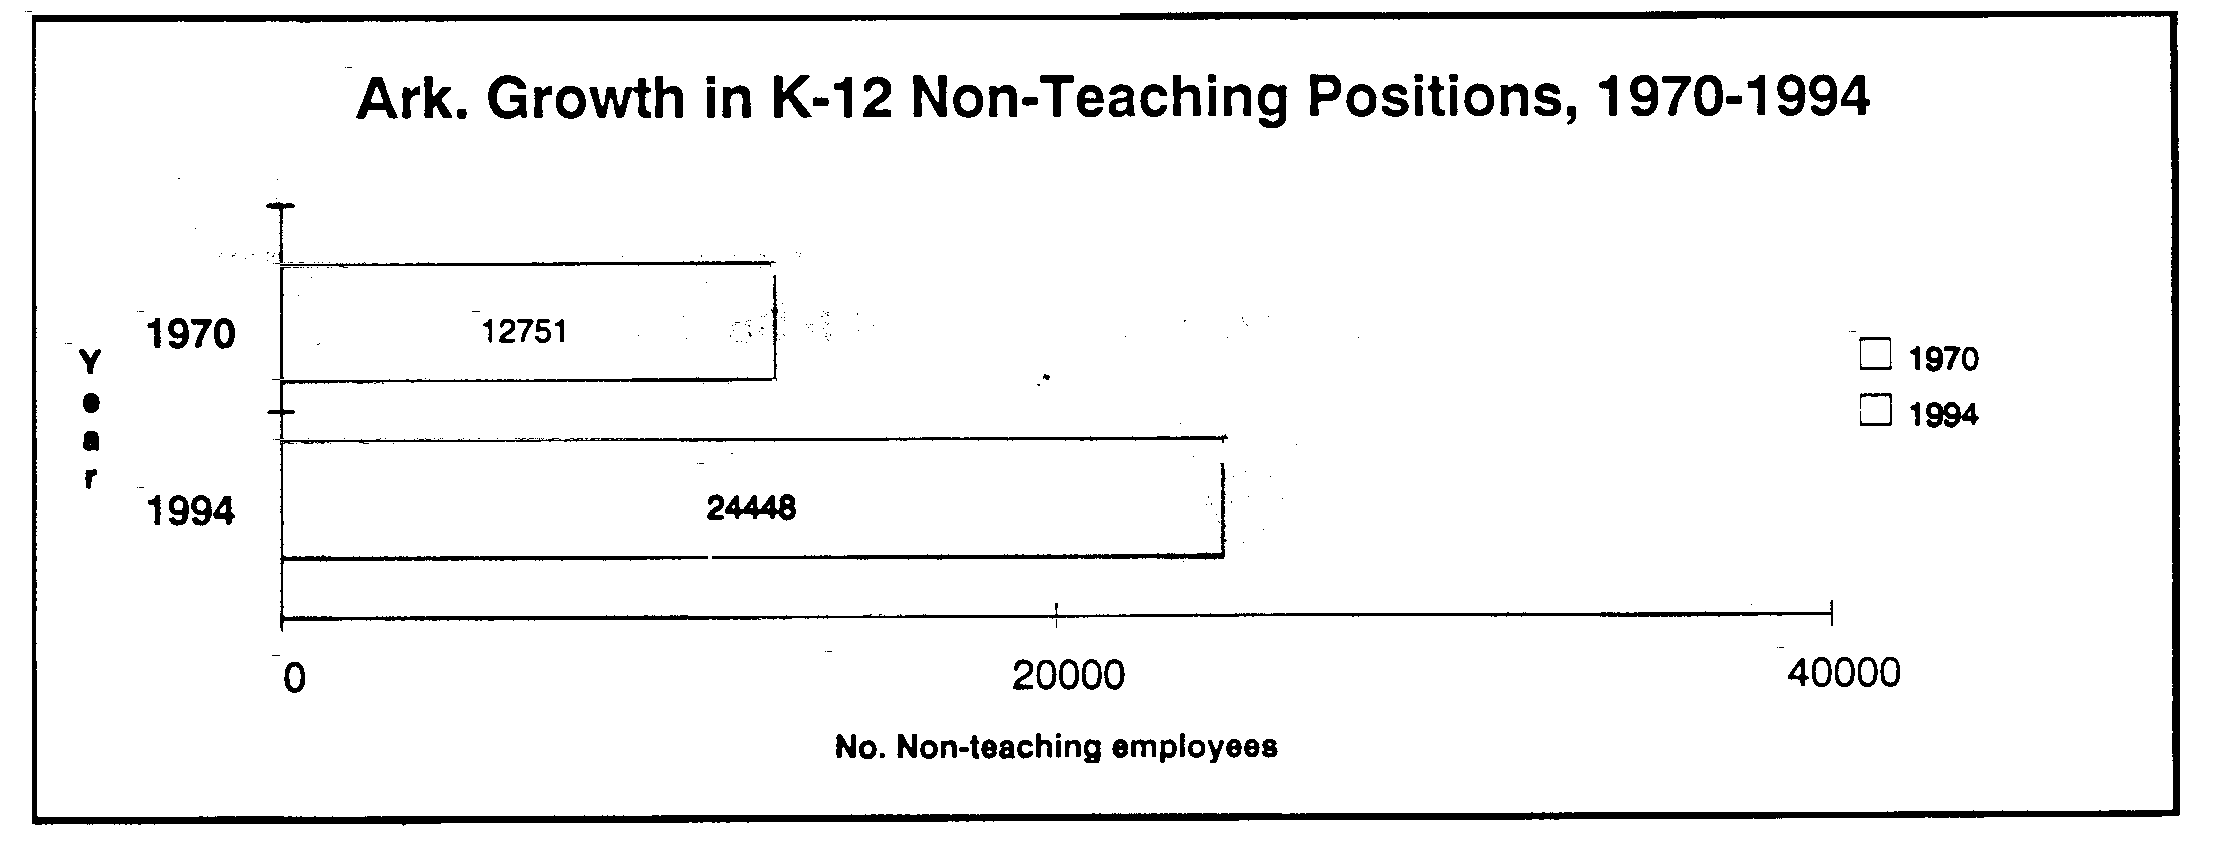
Arkansas ranks 17th among the 50 states in the highest number of school districts. Among its twelve Southeastern state neighbors, Arkansas ranks first in the highest number of school districts with 131 more than Georgia, the next highest with 180 districts. Arkansas ranks 34th in school enrollment. From 1970 to 1994, Arkansas non-teaching staff rose from 12,751 to 24,488, an increase of 94.8%. For the same period the number of teachers in the state increased 46.8%. Adjusted for inflation, per-pupil spending for non teaching/non-classroom activity in Arkansas has risen by 84.3% since 1972-73.
EXHIBIT 5
Source: 1996 Education Report Card on the States, American Legislative Exchange Council (ALEC)
The U.S. is the only nation in the world now where more than 50% of K-12 public education workers are not teachers. From 1970 until 1994 the number of non-teaching positions in Arkansas doubled. The number of teachers rose 46% during the same period. Adjusted for inflation, per-pupil spending on non-classroom activity in Arkansas has risen 84.3% since 1973. From 1970 to 1993 the state's student enrollment for public K-12 actually dropped from 460,701 to 459,255. Average Daily Attendance also fell from 414,158 to 411,306 (and this last number reflects adding in Kindergarten in 1987.) The number of school districts also dropped from 387 to 311.
EXHIBIT 6
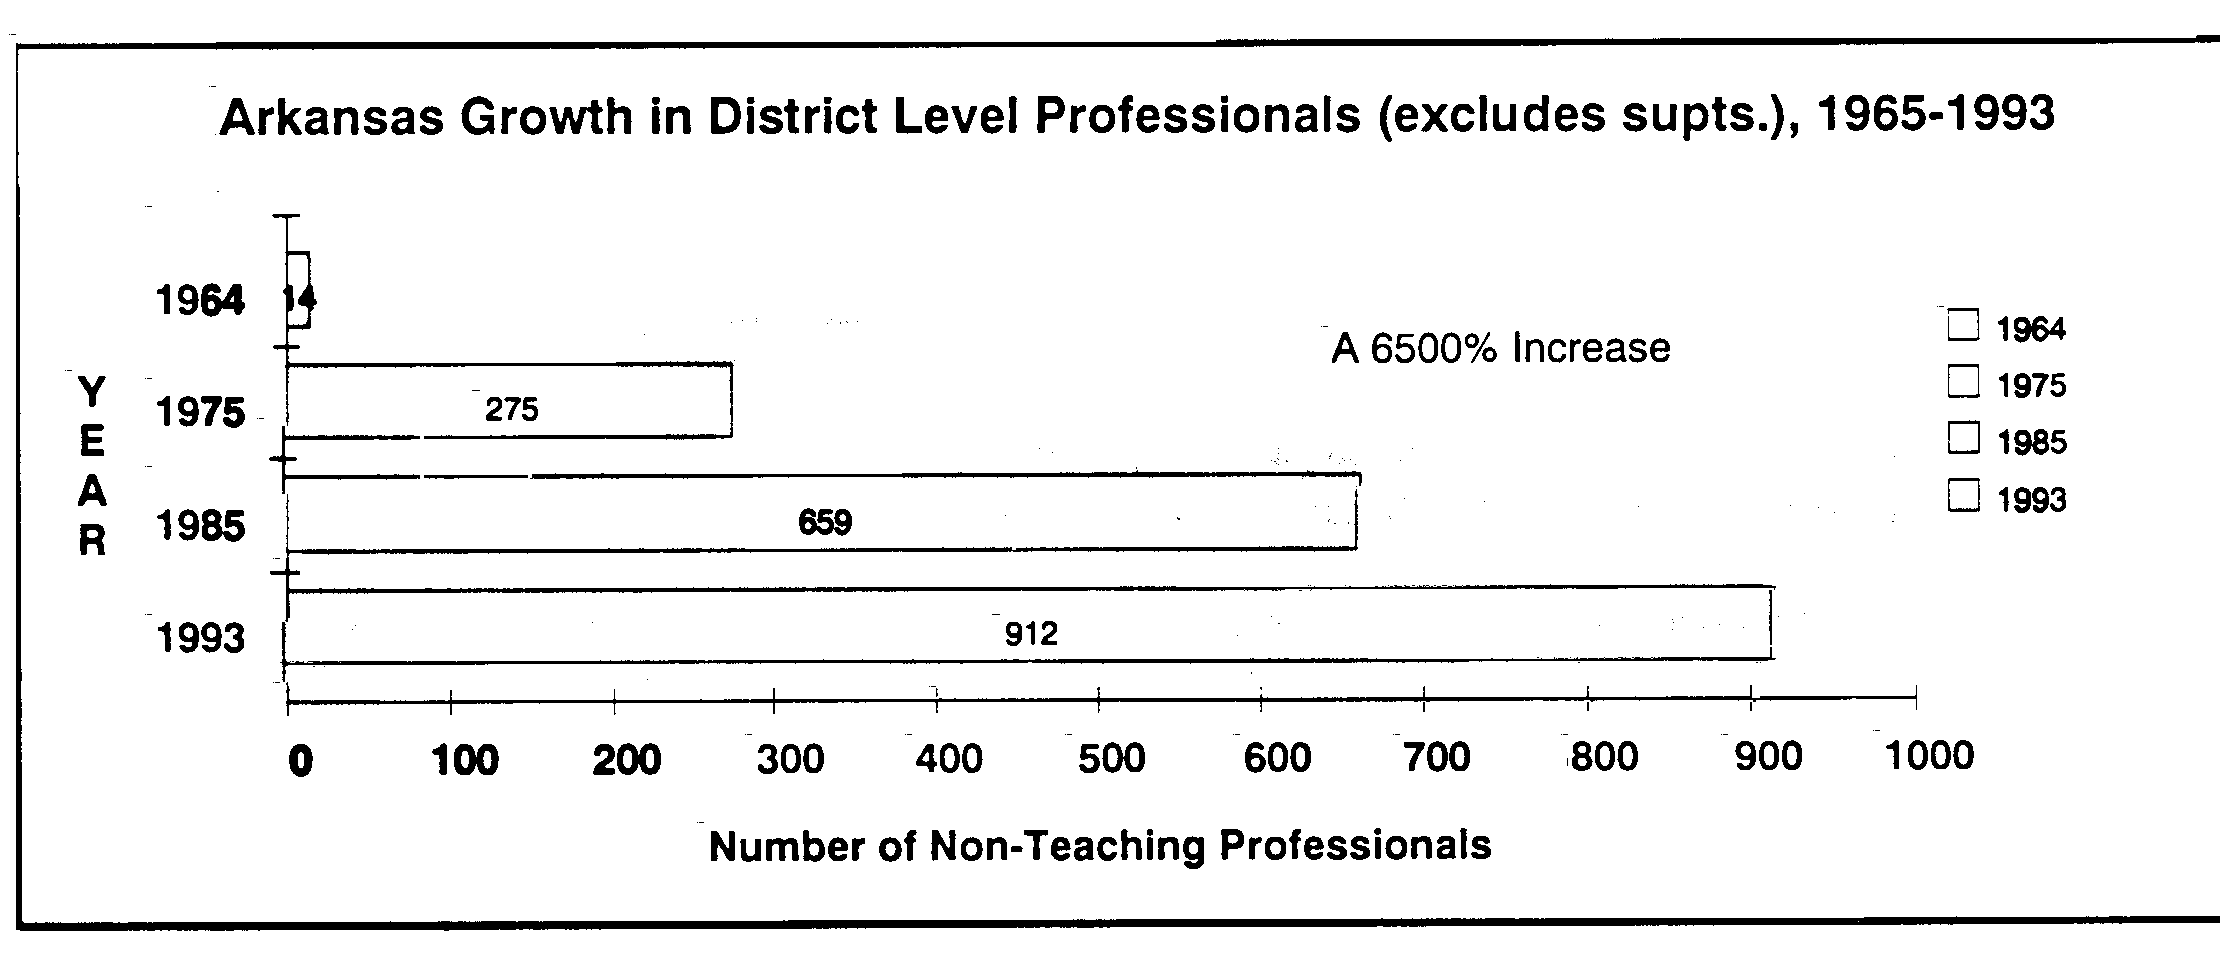
Source: Arkansas Department of Education and its Statistical Summaries of the Public Schools of Arkansas. The term professional includes Asst. Superintendents, Business Managers, Instructional Supervisors, and Psychological Personnel.
EXHIBIT 7
Source: Historical Report of the Secretary of State--Arkansas 1978, League of Women Voters Fact Sheet: Arkansas Boards and Commissions 1987, The Governor's Office on Boards and Commissions.
More than half of Arkansas existing 388 boards and commissions have been created in the last 19 years (since 1978.) The year prior to that, 1977, Arkansas adopted a sunset law to control and manage the proliferation of state boards and commissions. In 1983, then Governor Bill Clinton and both houses of the General Assembly allowed the sunset law to lapse. Some 37 states have board and commission sunset laws.
EXHIBIT 8
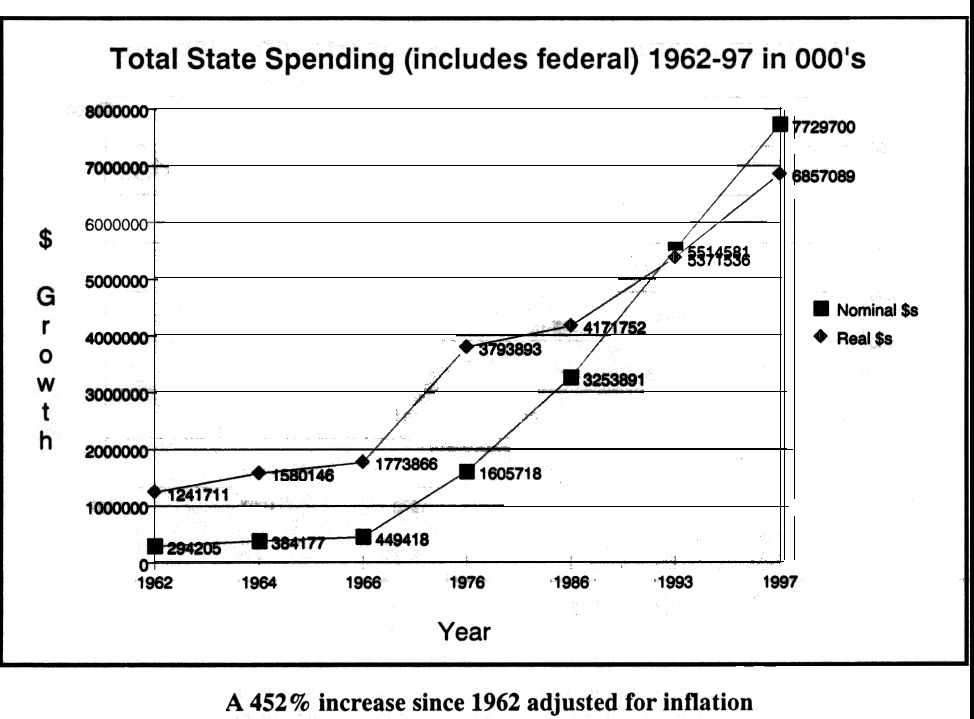
Source: UALR's Statistical Abstract of Arkansas, (Legislative Research Bureau figures) and the Arkansas Department of Finance and Administration for the 1997 spending figure. Adjusted for inflation in 92 dollars.
Much of the increase in spending, beginning in the early 1970's, occurred as a result of the proliferation of federally initiated programs at the state level.
EXHIBIT 9
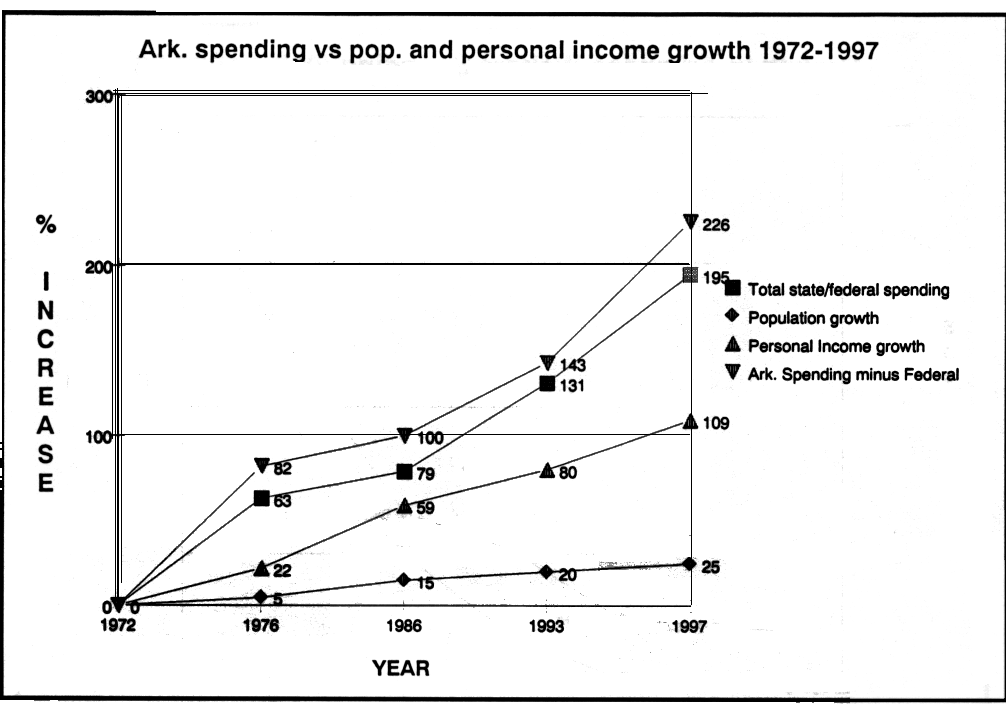
Sources: Council of State Governments, Book of the States for total spending percentage increases, the Arkansas Department of Finance and Administration and the Legislative Research Bureau for Arkansas spending percentages (less federal dollars). The U.S. Census Bureau for population increases. Dr. Ronn Hy, UCA, for personal income growth percentages.
The graph shows the gap (expressed as percentage increases for given years) between personal income growth in Arkansas and state spending growth--with federal dollars included as well as with only state dollars shown. An interesting side note: The rate at which Arkansas dollars only (no federal dollars) have been spent appears to be growing faster than the rate at which Arkansas spends state and federal dollars combined. Notice the difference in the rate of increase (percentage wise) between state dollars spent versus the rate of growth in personal income. The gap shows state spending at more than twice the rate of personal income.
EXHIBIT 10
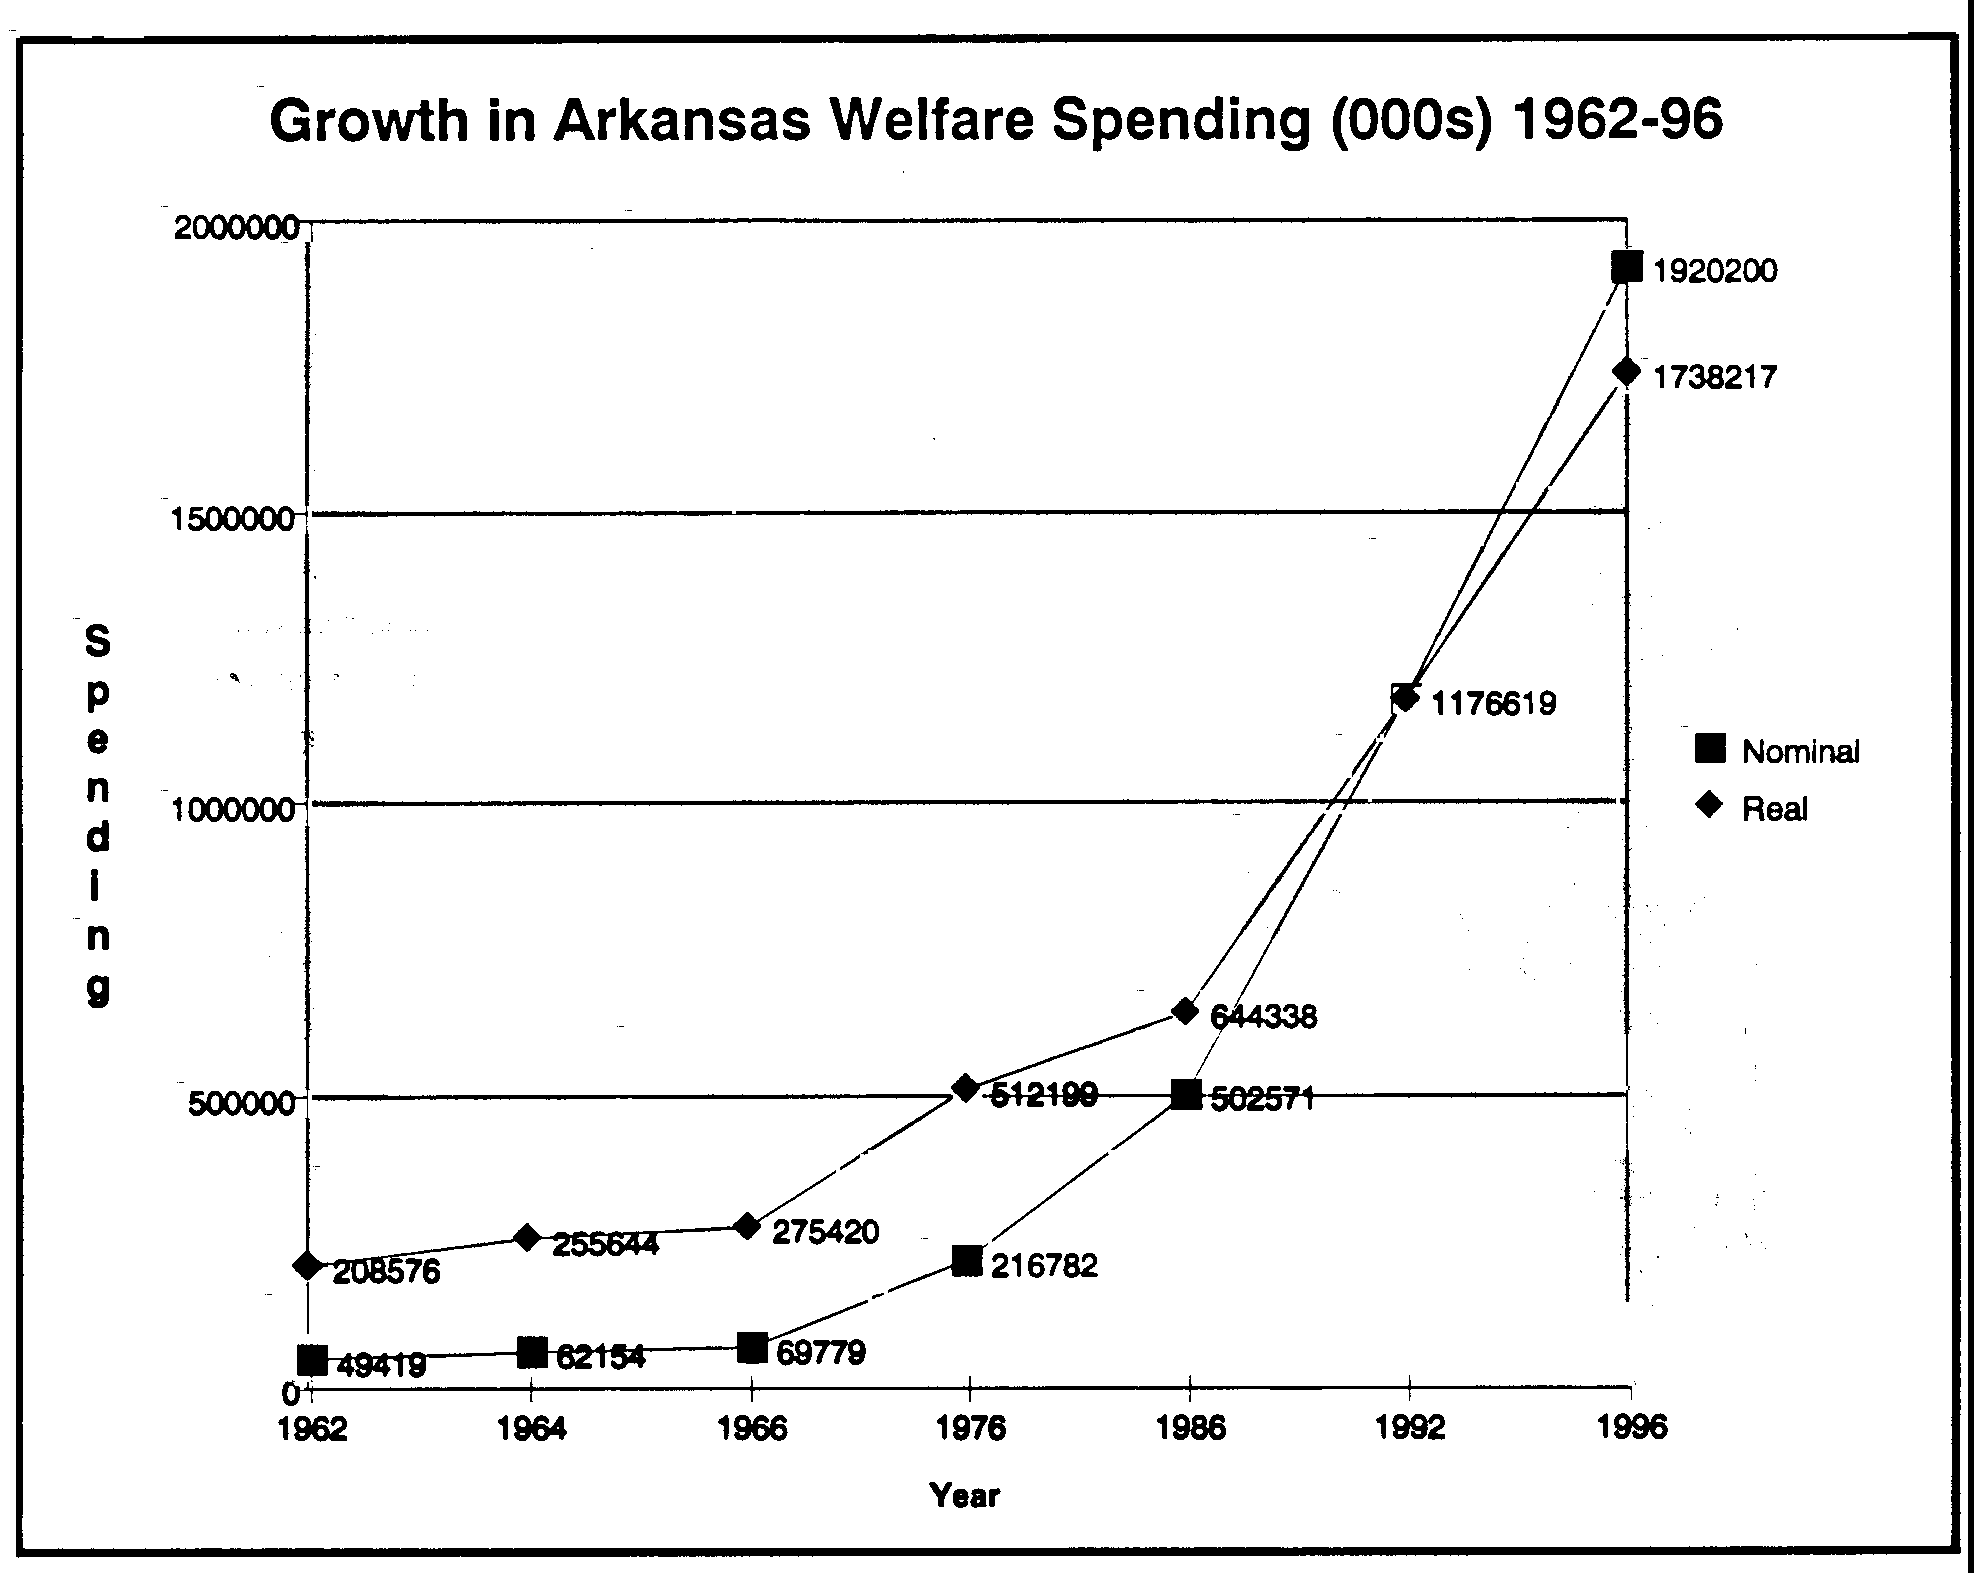
Source: The Council of State Governments, Book of the States for the years designated.
Adjusted for inflation this rise in Arkansas welfare spending from 1962 to 1996 is more than 700%.
EXHIBIT 11
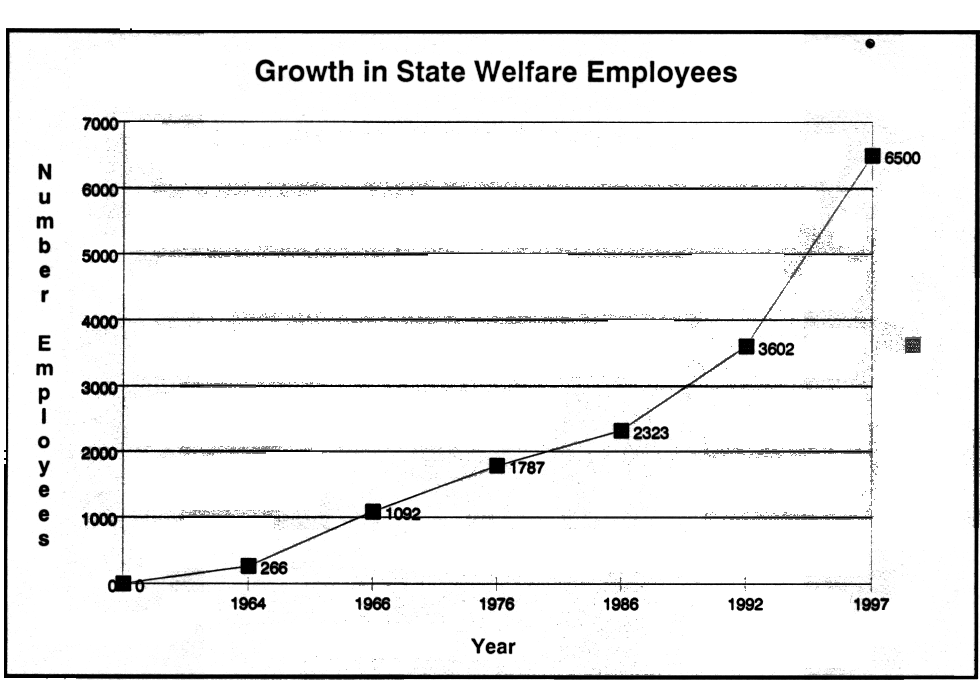
Source: The Council of State Governments Book of the States for the years designated (except 1997) and the Director's Office, Arkansas Department of Human Services for 1997 figure.
Shown is a 2343% increase since 1964 in the number of welfare employees who are functionally active or directly supportive in the delivery of various "welfare" services in Arkansas. The latest figure, 65011, came from Director of DHS, Lee Frazier, who indicated by phone that the Department had just recomputed the number of people directly serving the welfare function and had set it at 6500. The actual number in Arkansas may be much higher because other welfare services are centered in other agencies, i.e. the Health Department. A more likely figure is 8000-9000. The population has increased slightly more than 30% since 1962. The poverty level has hovered around 21-22% of the population.